

You are reviewing a B2B SaaS target with 92% logo retention. Management presents this as proof of sticky customers. The CIM calls it “best-in-class.” But when you pull the actual billing data and build dollar-weighted cohorts, you discover that retained customers contracted 18% on average at renewal. The net revenue retention sits at 78%. The business is slowly deflating, one downgrade at a time, and logo retention masked the entire story.
This is not an edge case. I have seen it repeatedly in confirmatory diligence, where a seller’s retention narrative survives initial screening but collapses under cohort-level scrutiny. The commercial consequence is direct: a 78% NRR means the existing customer base will contribute roughly half its current revenue in three years, before any new bookings. Your growth investment thesis just became a replacement-selling thesis, and the multiple you modeled no longer holds.
Net revenue retention is the metric that tells you whether the installed base is a compounding asset or a depreciating one. This guide covers how to build honest cohorts, where contraction signals hide, and which diligence questions expose the real retention story before you close.
Logo retention that conceals dollar churn
Logo retention counts customers who stayed. Net revenue retention counts what those customers actually pay. The gap between these two numbers is where value creation assumptions go wrong.
Consider a target with 100 customers at the start of the year, each paying $10,000 annually. Ten customers churn entirely. Logo retention: 90%. But of the 90 retained customers, 30 downgraded to a $6,000 tier. The dollar retention on retained logos is now $780,000 on a $900,000 retained base, or 87% gross revenue retention. If 15 of those 90 customers expanded by $2,000 each, you add $30,000 back, bringing net revenue retention to roughly 81%.
The management deck showed 90% retention. The actual commercial reality is an 81% NRR, meaning the base erodes 19% annually before expansion. That erosion compounds. According to McKinsey’s analysis of SaaS economics, the difference between 80% and 120% NRR over a five-year hold can represent a 2-3x variance in terminal value from the existing customer base alone.
The diligence task is to reconstruct the true retention picture from raw data, not management summaries.

Why both gross and net revenue retention matter in diligence
Gross revenue retention (GRR) measures what you keep from existing customers before counting any expansion. It captures churn and contraction only. Net revenue retention (NRR) adds expansion and upsells back in. Both numbers tell you something different about the business.
What GRR Reveals
GRR is a ceiling. It tells you the maximum revenue the current base can contribute if you stopped all upselling tomorrow. A GRR of 85% means you lose 15% of your base annually to churn and downgrades, regardless of expansion efforts. This is the gravitational pull working against growth.
For diligence purposes, GRR exposes product-market fit erosion. If customers are leaving or shrinking, no amount of expansion selling fixes the underlying issue. According to Bain’s customer loyalty research, high contraction rates often precede churn spikes by 12 to 18 months, making GRR an early warning signal.
What NRR Reveals
NRR shows whether the existing base is self-funding growth. An NRR above 100% means expansion exceeds churn and contraction. The base grows without new customer acquisition. An NRR below 100% means every sales dollar goes toward replacing lost revenue before it can contribute to growth.
The net revenue retention benchmark varies by segment. BCG’s software growth analysis suggests that enterprise SaaS businesses with strong expansion typically run 110% to 130% NRR, while SMB-focused products often sit between 90% and 105% due to higher churn and limited expansion potential.
The Diligence Implication
When I review a target’s retention, I want to see both numbers tracked separately over time. A business with 115% NRR but 80% GRR is heavily dependent on expansion to paper over churn. If the expansion engine stalls, or if the remaining base has already been upsold, the business reverts to its GRR floor quickly. That is a different risk profile than a business with 95% GRR and 105% NRR, where the base is fundamentally stable and expansion provides modest uplift.
Understanding commercial due diligence red flags often starts with pulling apart these two metrics and examining what drives each.
Building honest cohorts for retention analysis
Management-reported retention often uses trailing twelve-month averages that smooth over seasonal patterns and obscure recent deterioration. Cohort analysis shows you how specific groups of customers behave over time, which is where the real story lives.
Defining Cohorts Correctly
A cohort is a group of customers who started in the same period, usually by contract start month or quarter. You then track what that cohort pays in each subsequent period. The goal is to see retention curves, not averages.
For diligence, I typically request raw data to build cohorts by:
- Contract start date: The month or quarter the customer first paid.
- Initial contract value: What they signed for at inception.
- Each subsequent period’s revenue: Monthly or quarterly, depending on billing cycle.
- Churn date: When they stopped paying entirely.
- Contraction events: When they moved to a lower tier or reduced seats.
- Expansion events: When they added products, tiers, or seats.
What Cohort Curves Expose
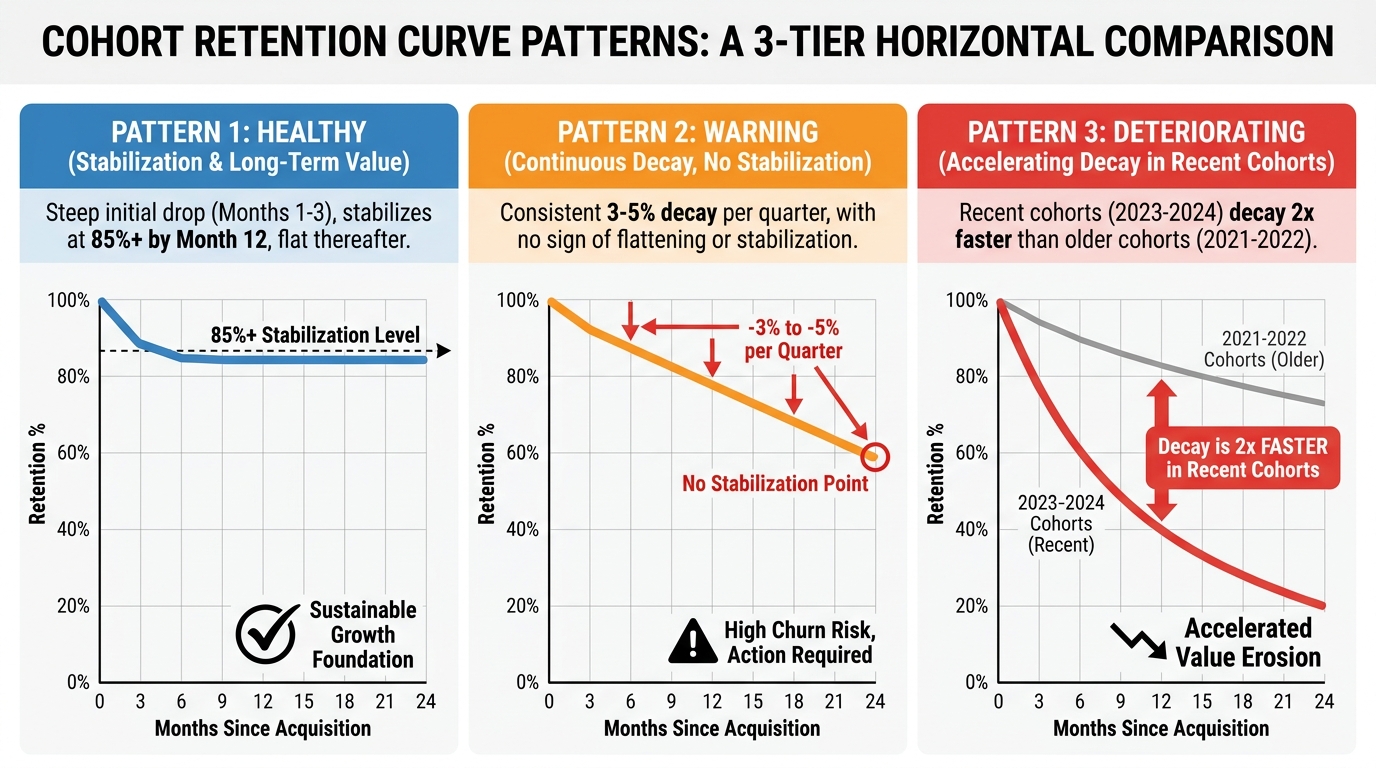
Healthy cohorts show a gradual decline in the first 12 months, then stabilize. The customers who survive year one tend to stick. Unhealthy cohorts show continuous decay, where each quarter loses another slice of revenue. The worst pattern is acceleration, where recent cohorts decay faster than older ones, suggesting product-market fit is weakening or the customer acquisition strategy is pulling in lower-quality buyers.
When conducting GTM due diligence and assessing revenue quality, cohort behavior by acquisition channel often reveals whether certain sales motions produce durable customers or churn factories.
Where contraction and downgrade signals hide
Churn is visible. Contraction is quiet. A customer who downgrades from enterprise to professional tier, or reduces seats from 50 to 20, does not show up in logo churn. But they represent significant dollar erosion that accumulates over time.
Common Contraction Patterns
In diligence, I look for these contraction signals:
- Seat reduction at renewal: The customer stays but right-sizes their license count. This often indicates they over-bought initially or adoption stalled.
- Tier downgrades: Moving from a premium SKU to a basic one. This suggests the customer is not extracting value from advanced features.
- Module removal: Dropping add-on products while keeping the core. This can indicate competitive displacement on specific use cases.
- Price concession at renewal: The customer negotiated a lower rate to stay. This is contraction even if the contract structure looks unchanged.
Quantifying Contraction Separately
I ask targets to break out churn analysis into three components: logo churn (customers lost entirely), contraction (revenue lost from retained customers), and expansion (revenue gained from retained customers). Many businesses only track the first and third, leaving contraction buried in net figures.
A business with 5% logo churn and 12% contraction has a very different profile than one with 10% logo churn and 2% contraction. The first suggests customers like the product enough to stay but not enough to maintain spend. The second suggests a cleaner exit pattern, where customers who do not fit simply leave. Which of those two profiles you are buying changes what else you test. Retention sits alongside pricing, win rates and customer concentration in the commercial due diligence checklist, and the retention finding is usually the one that tells you which of the others to pull on next.
Renewal timing and concentration overlap
Retention metrics assume renewals are distributed evenly across the year. In practice, many B2B businesses have renewal concentration, where a significant portion of ARR comes up for renewal in a narrow window. This creates risk that trailing metrics do not capture.
Renewal Concentration Risk
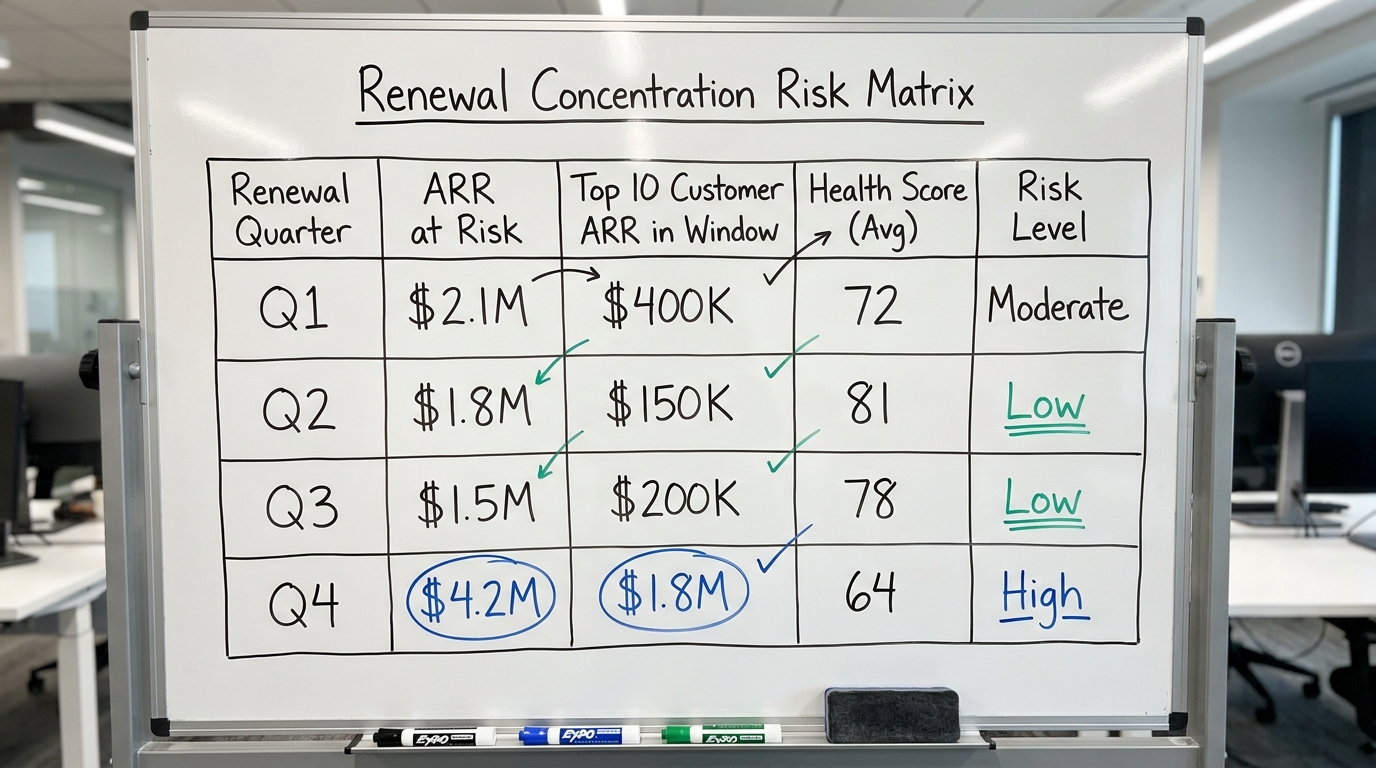
If 40% of ARR renews in Q4, the retention number you see in Q2 diligence does not reflect current-year performance. The real test is still ahead. I have seen deals where management presented strong retention through September, only for the Q4 renewal wave to bring a cluster of losses that changed the entire picture.
For diligence, request a renewal schedule showing ARR by renewal month for the next 12 to 18 months. Overlay this with customer health indicators, such as usage data, support ticket trends, and NPS scores, to identify which renewals carry risk.
Concentration Overlap with Revenue Concentration
Renewal timing becomes acute when combined with customer concentration. If your top five customers represent 35% of ARR and three of them renew in the same quarter, you have a single-quarter event that can swing retention dramatically. This is not reflected in historical retention metrics but represents forward-looking risk that affects deal structure.
When running a B2B portfolio revenue leakage diagnostic, renewal concentration is one of the first areas I examine because it determines where near-term revenue risk actually sits.
Segment-level retention differences that affect valuation
Blended retention metrics hide segment-level variance that matters for underwriting. A business with 100% NRR overall might have 130% NRR in enterprise and 75% NRR in SMB. The value creation thesis depends entirely on which segment you plan to grow.
Segmentation Dimensions That Matter
For B2B SaaS, I typically segment retention by:
- Customer size: Enterprise, mid-market, SMB. Retention behavior differs dramatically across these tiers.
- Product line: If the business sells multiple products, each may have different retention characteristics.
- Acquisition channel: Inbound versus outbound, partner-sourced versus direct. Channel often correlates with customer quality.
- Geography: Domestic versus international customers may have different retention profiles due to support coverage, competitive dynamics, or economic conditions.
- Cohort vintage: Customers acquired in different years may behave differently due to product changes, pricing changes, or market conditions at the time of acquisition.
The Segment Mix Shift Problem
Be cautious of retention metrics that improve because segment mix shifted, not because retention actually got better. If a business stopped selling to SMB and focused on enterprise, blended retention will rise even if enterprise retention stayed flat. The improvement is real but not repeatable. You cannot keep shifting mix indefinitely.
For diligence, I ask for retention metrics by segment over time, not just current period. This shows whether each segment is stable or whether the blended number is being managed through mix.
Retention red flags and diligence questions
After reviewing retention data on dozens of targets, certain patterns consistently signal problems worth investigating further.
Red Flags in Retention Data
- NRR above 100% but GRR below 85%: Heavy dependence on expansion to offset churn. Sustainable only if expansion runway remains.
- Recent cohorts underperforming older cohorts: Product-market fit may be weakening or customer acquisition quality declining.
- Retention improving while growth slows: May indicate the business is harvesting the best customers and losing the marginal ones, which flatters retention but limits TAM.
- Large gap between management-reported retention and cohort-derived retention: Suggests definitional games or data quality issues.
- Contraction rate increasing over time: Customers are staying but spending less, often a precursor to churn spikes.
- Retention metrics exclude certain customer types: Watch for exclusions like “excluding one-time buyers” or “excluding customers below $X” that remove inconvenient data.
Diligence Questions to Ask
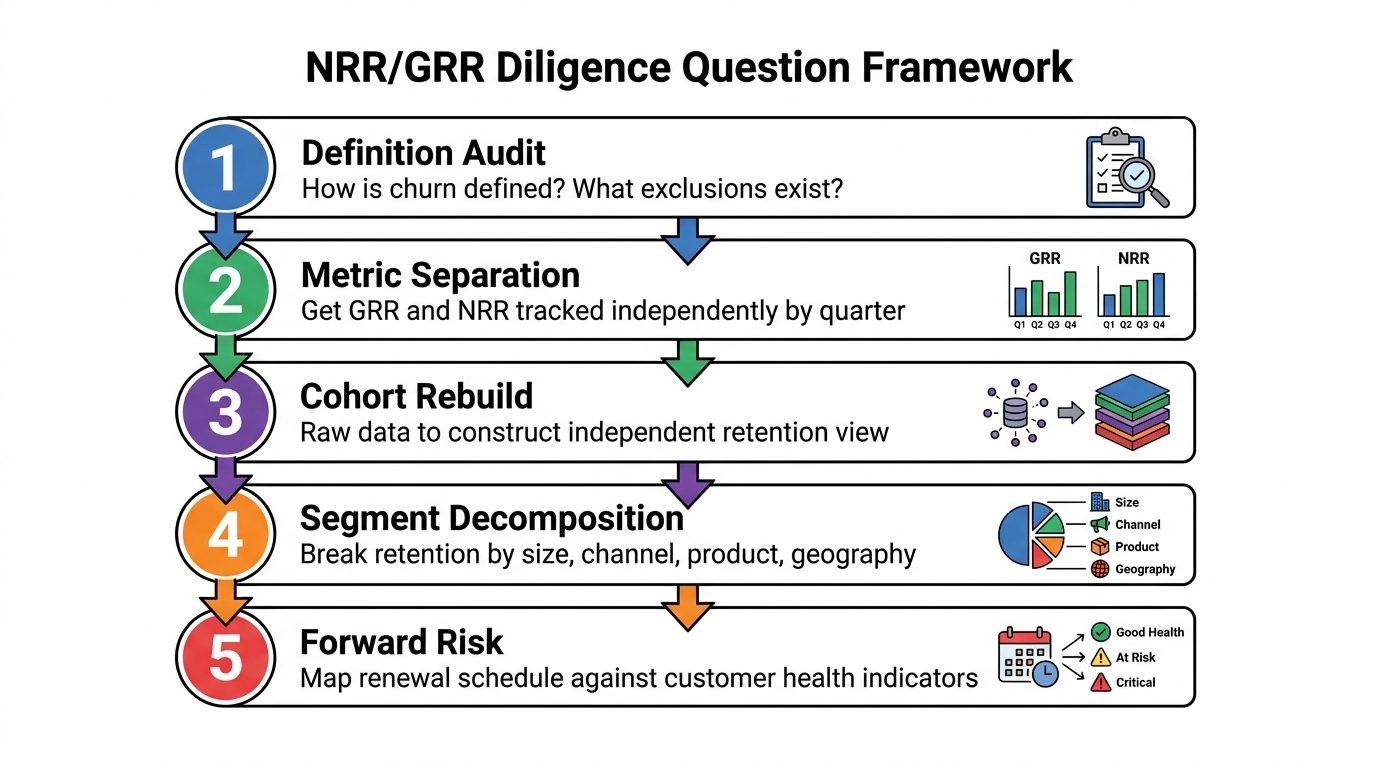
Based on these patterns, here are the questions I include in every retention-focused diligence process:
- How do you define a churned customer? When does the clock start?
- What is GRR separate from NRR, and how has each trended over the past eight quarters?
- Can you provide raw billing data to reconstruct cohort retention independently?
- What percentage of retained customers contracted at their most recent renewal?
- Which customer segments have the highest and lowest retention? Why?
- What is the renewal schedule for the next 12 months, broken out by customer size?
- How does retention differ by acquisition channel?
- Have there been any pricing changes in the past 24 months that affect period-over-period comparability?
- What percentage of expansion revenue comes from price increases versus genuine upsells?
- Are any customers on non-standard terms that affect renewal timing or pricing?
These questions, combined with independent cohort analysis, will expose most retention issues before they become post-close surprises. Working with specialists in RevOps for PE-backed companies can accelerate this work when deal timelines are compressed.
Cohort retention worksheet and NRR/GRR diligence checklist
Below are two working tools I use in retention diligence. The first is a cohort retention worksheet structure for organizing the raw data analysis. The second is a checklist for validating management’s retention claims.
Cohort Retention Worksheet
| Cohort (Start Quarter) | Starting ARR | Logo Count | Month 3 ARR | Month 6 ARR | Month 9 ARR | Month 12 ARR | Month 12 GRR | Month 12 NRR | Churn $ | Contraction $ | Expansion $ |
|---|---|---|---|---|---|---|---|---|---|---|---|
| Q1 2022 | |||||||||||
| Q2 2022 | |||||||||||
| Q3 2022 | |||||||||||
| Q4 2022 | |||||||||||
| Q1 2023 | |||||||||||
| Q2 2023 | |||||||||||
| Q3 2023 | |||||||||||
| Q4 2023 |
Notes: Populate from raw billing/CRM export. Calculate GRR as (Starting ARR minus Churn minus Contraction) divided by Starting ARR. Calculate NRR as (Starting ARR minus Churn minus Contraction plus Expansion) divided by Starting ARR. Compare cohort performance across vintages to identify deterioration trends.
NRR/GRR Diligence Checklist
| Checklist Item | Status | Finding / Notes |
|---|---|---|
| Obtained written definition of churn, contraction, expansion from management | ☐ | |
| Received raw billing data (not summarized) for cohort reconstruction | ☐ | |
| Verified GRR is tracked separately from NRR | ☐ | |
| Confirmed no customer exclusions in retention calculations | ☐ | |
| Built independent cohort retention curves by quarter | ☐ | |
| Compared management-reported retention to cohort-derived retention | ☐ | |
| Segmented retention by customer size tier | ☐ | |
| Segmented retention by acquisition channel | ☐ | |
| Segmented retention by product line (if applicable) | ☐ | |
| Identified contraction rate separately from churn rate | ☐ | |
| Mapped renewal schedule for next 12 months by ARR | ☐ | |
| Overlaid renewal schedule with customer concentration data | ☐ | |
| Assessed whether expansion is price-driven or volume-driven | ☐ | |
| Checked for pricing changes affecting period comparability | ☐ | |
| Evaluated whether recent cohorts underperform older cohorts | ☐ | |
| Documented all retention red flags for deal team review | ☐ |
The retention picture that survives scrutiny
Net revenue retention determines whether an installed base is a compounding asset or a depreciating liability. The difference between a 78% NRR and a 115% NRR is not a reporting nuance. It is a fundamental divergence in business quality that affects hold-period returns, growth capital requirements, and exit multiples.
The work is straightforward but often not done thoroughly: get raw data, build cohorts independently, separate GRR from NRR, decompose by segment, and map forward renewal risk. Management presentations will give you a number. Diligence gives you the truth behind it.
A clean logo retention figure that hides dollar erosion is one of the most common gaps between a seller’s narrative and commercial reality. Finding it before close is the difference between a thesis that holds and a plan that unravels in the first board meeting.
To rebuild cohorts from the raw CRM and billing data on a live deal, DevriX can produce the honest retention view.
