Overview: What Changed and Why It Stopped Working
A value creation plan is the operating blueprint a private equity sponsor builds at close. It names the EBITDA target, the margin expansion levers, the revenue growth model, the cost-reduction initiatives, and the capital expenditure plan. The review cadence determines how often the sponsor and the portfolio company leadership compare actual performance to that plan and decide whether to adjust it.
For most of the 2010s, that review happened annually. The logic was sound: PE hold periods ran 5-7 years, the plan was built on 12-month rolling forecasts, and the operating environment stayed predictable enough that a yearly check-in caught most variance before it became material. The annual review aligned with audit cycles, board schedules, and fund reporting to limited partners.
That model broke when three things happened at once. First, interest rates rose and debt service became a larger share of EBITDA, which meant smaller variance mattered more. Second, customer acquisition cost across digital channels became more volatile as privacy regulation (GDPR, iOS tracking changes) and platform algorithm shifts made historical CAC a weak predictor of next quarter’s cost. Third, the market for talent tightened and compensation shifted faster than annual comp reviews could track, which meant headcount plans built in Q4 were obsolete by Q2.
The firms that moved first were the ones holding B2B software companies, where churn and expansion revenue move quarterly and where a single large customer loss can swing EBITDA by 5-10 points. They built quarterly operating reviews that surfaced variance at the metric level, gave operating partners decision rights without requiring a full board cycle, and connected the review process to live data rather than monthly finance packs assembled 15 days after month close.
Who Should Be Running Quarterly Reviews
Not every portfolio company needs a quarterly cadence. A distribution business with stable margins, predictable volume, and annual contract cycles can still run on an annual review if its operating environment is not shifting. Variance determines whether quarterly reviews are necessary, not the sophistication of the business model.
Three profiles need quarterly reviews:
- Companies with high digital CAC exposure: Any business where paid acquisition drives more than 30% of new customer volume and where CAC has moved more than 15% in either direction within a single quarter in the past 18 months. This includes D2C brands, lead-generation businesses, and B2B companies running demand-gen campaigns at scale.
- Multi-location service businesses during expansion: Restoration, healthcare, home services, or franchise models adding locations faster than twice per year. Each new location carries a 6-12 month ramp to breakeven, and if the ramp takes longer than modeled, it compounds across the portfolio. The annual review catches that lag too late.
- Platform acquisition strategies: Any portco executing a buy-and-build where the plan includes more than one acquisition per year. Integration costs, revenue synergies, and customer retention all carry quarterly variance that determines whether the second and third acquisitions make sense. Waiting 12 months to surface an integration problem means the next deal closes before the first one is fixed.
The common thread is that these businesses operate in environments where the assumptions in the value creation plan degrade faster than a year. If your plan assumed $80 blended CAC and you are now paying $105, or if it assumed 85% customer retention and you are running at 78%, waiting until the annual review to re-plan means the sponsor is managing to a forecast that no longer describes the business.
The Three Numbers That Trigger a Re-Plan
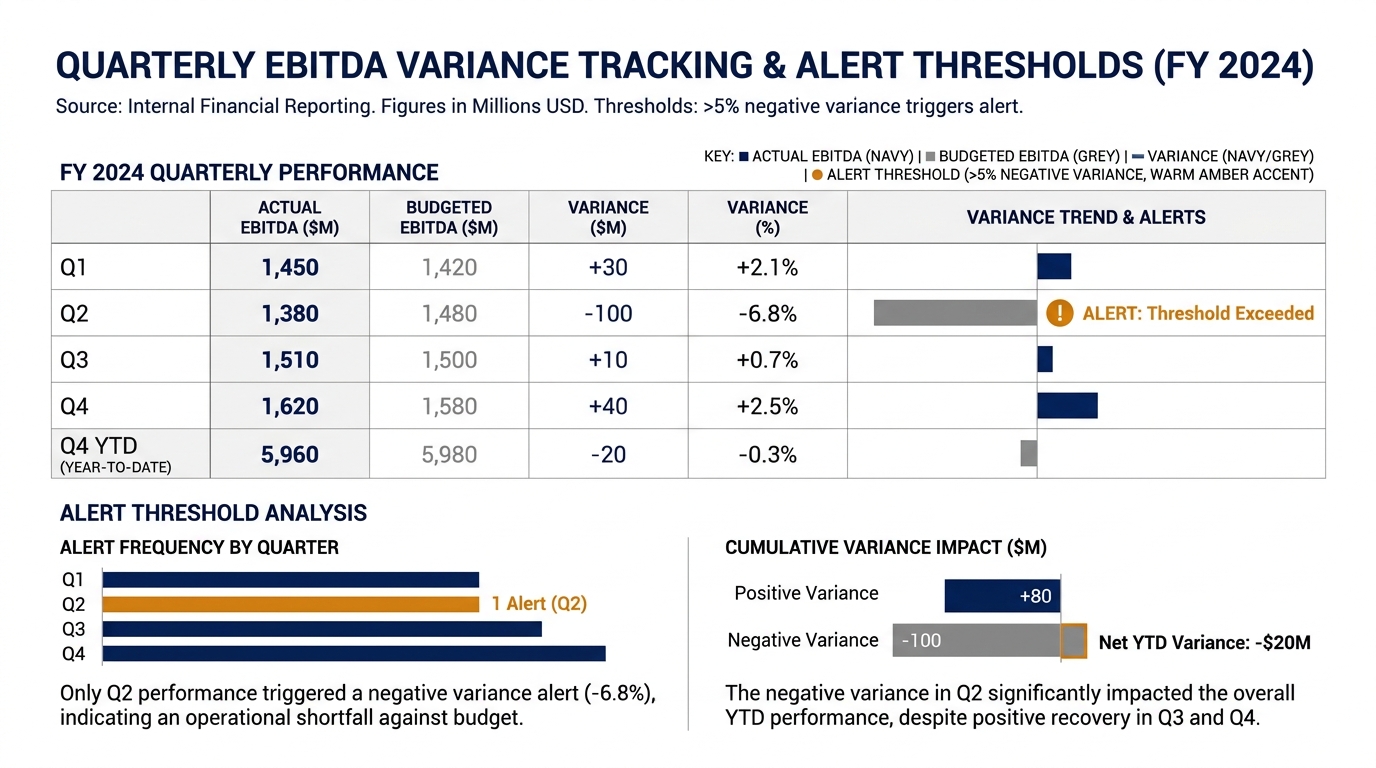
A quarterly review is not a quarterly re-plan. Most quarters, the review confirms that variance is within tolerance and the plan holds. The discipline is knowing which three numbers, when breached, require the sponsor and the management team to rebuild the forecast and adjust the operating playbook.
EBITDA variance beyond 8%. If actual EBITDA trails the plan by more than 8% for two consecutive quarters, the plan’s margin assumptions or revenue model are wrong. An 8% variance on a $50M revenue business is $400K per quarter, or $1.6M annualized. On a 5x exit multiple, that is $8M of enterprise value at risk. The re-plan involves isolating whether the miss is revenue (volume, price, or mix), gross margin (COGS, labor efficiency), or operating expense (headcount, software, facilities), then rebuilding the forecast with the corrected driver.
CAC movement exceeding 15% for two consecutive quarters. Customer acquisition cost moves quarter to quarter, but sustained movement beyond 15% means something structural changed: platform algorithm shifts, competitive spend increases, creative fatigue, or audience saturation. The original plan’s growth assumptions depended on a CAC model that no longer works. The re-plan recalculates unit economics (LTV:CAC ratio, payback period), adjusts the growth forecast, and either increases the marketing budget to maintain volume or lowers the revenue target to match sustainable acquisition spend.
Integration costs on an acquisition running 25% over budget after 90 days. Platform acquisitions carry an integration cost estimate in the original plan, typically budgeted as a percentage of deal value. If actual integration spend is running 25% over budget by day 90, the problem is either scope creep (more technical debt than diligence caught), timeline extension (key personnel left, systems did not connect), or underestimated labor (internal team capacity was insufficient). Waiting until month 12 to address this means the cost overrun compounds and the timeline to synergies extends. The re-plan isolates the cost driver, adjusts the synergy timeline, and reforecasts the combined entity’s EBITDA.
These thresholds are not universal. A higher-margin SaaS business might tighten EBITDA tolerance to 5%, while a lower-margin distribution business might set it at 10%. The principle is that each number represents a structural assumption in the plan, and when it breaks, forecasting forward on the old assumption produces a number the business will never hit.
Pros: What Quarterly Review Cadence Delivers
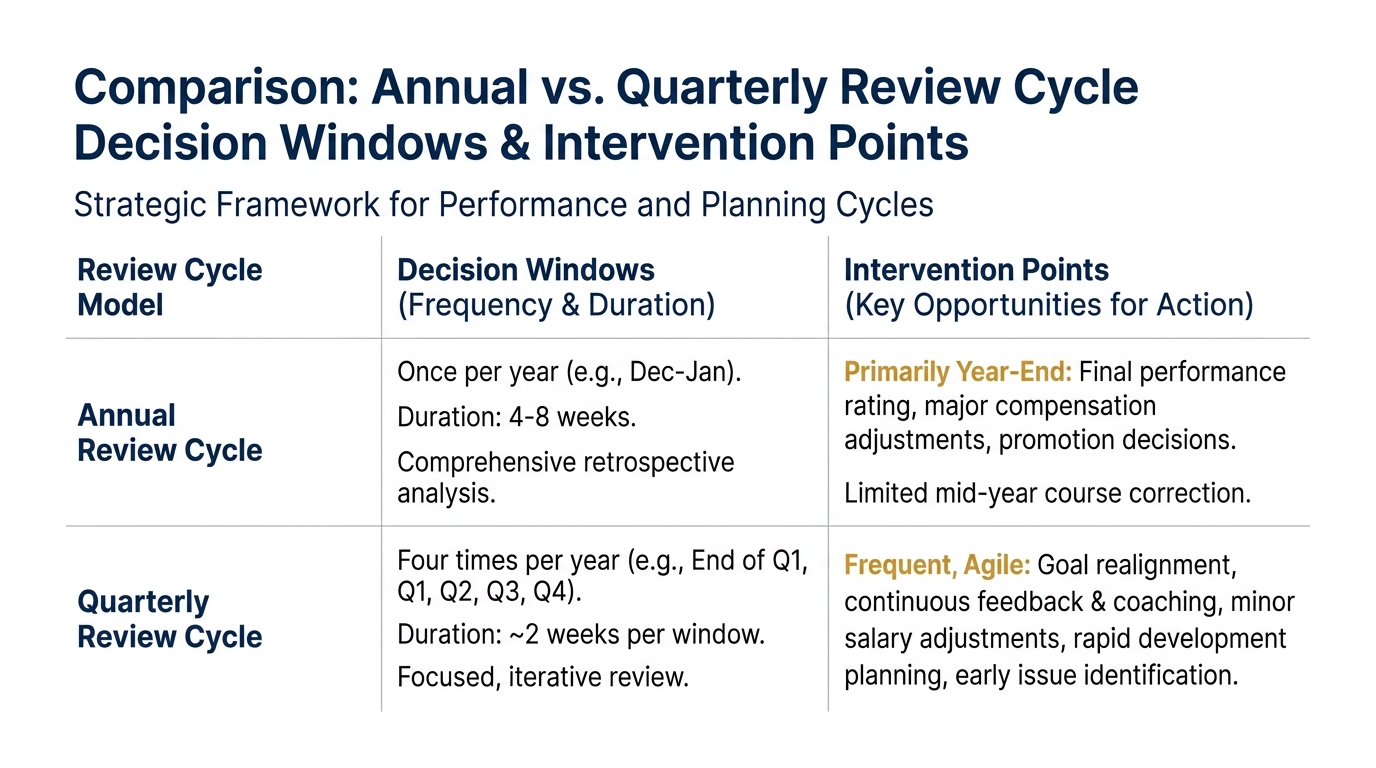
The benefit of a quarterly review is decision speed. When variance surfaces in month two of a quarter rather than month eleven of a year, the operating partner and the CEO have more options. A CAC spike caught in Q1 allows time to test new creative, shift budget to owned channels, or renegotiate media rates before the full year’s growth plan is compromised. The same spike caught in November leaves only one option: miss the year.
Second benefit is board confidence. A sponsor presenting to limited partners with quarterly variance data and documented plan adjustments demonstrates control. The LP sees that the team is managing the business actively rather than discovering problems at year-end. That confidence matters more on difficult holds where the exit timeline extends or where a down-round becomes likely.
Third benefit is talent retention at the portco. A management team that sees the sponsor respond to operating data quarterly rather than annually trusts that the sponsor understands the business. The CEO of a home services platform told me his CFO stayed through a difficult 18-month period because the operating partner adjusted the EBITDA target mid-year when CAC spiked rather than holding him to a number the market had already made impossible. That kind of responsiveness keeps the team intact through volatility, which matters more than any single quarter’s variance.
Cons: The Overhead and the Reporting Trap
Quarterly reviews cost time. The operating partner spends 6-8 hours per quarter per portfolio company preparing the materials, running the session, and documenting decisions. At a 10-company portfolio, that is 60-80 hours per quarter, or roughly one full week. Smaller teams and newer funds do not always have that capacity, which is why the annual cadence persists even when the business would benefit from quarterly.
Second cost is the dashboard build. A useful quarterly review runs on live data connections, not Excel exports assembled manually. That means connecting the ERP, the CRM, the financial consolidation tool, and any marketing automation or analytics platforms into a single reporting layer. For a $30M-$50M business, that build typically runs $40K-$80K and takes 60-90 days if the data is clean. If the data is not clean (inconsistent chart of accounts, CRM records missing fields, attribution broken), the build extends to 120+ days and the cost doubles. Many mid-market portcos defer the dashboard because the cost and timeline feel heavy relative to the perceived benefit, so they continue running quarterly reviews off manually assembled decks. That process burns internal finance capacity and produces stale data, which defeats the purpose of the quarterly cadence.
The third risk is metric proliferation. A poorly designed quarterly review tracks too many numbers and flags variance that does not matter. I have seen 40-slide quarterly decks that surface 60+ metrics, most of which are lagging indicators or operational detail that belongs in a weekly ops call, not a board-level review. The operating partner and the CEO spend the session explaining noise rather than isolating the three numbers that require a decision. The discipline is limiting the review to the metrics that tie directly to EBITDA, cash flow, or enterprise value, and giving every other number a different forum.
Pricing Reality: What It Costs to Build and Run This
The dashboard build for a quarterly review at a $30M-$100M portfolio company typically runs $50K-$120K, depending on system complexity and data quality. That includes data connections (ERP, CRM, marketing), the reporting layer (Tableau, Power BI, or a custom build), the alert logic that flags variance thresholds, and the first training session for the finance and leadership teams. The build assumes the business already has clean systems. If CRM hygiene is poor or the chart of accounts is inconsistent, add 30-60 days and $20K-$40K for data remediation.
Operating cost is $3K-$6K per quarter for dashboard maintenance (updating connections, adding new metrics as the business evolves, troubleshooting data breaks) plus the internal time cost of running the review. The operating partner’s time is sunk cost from the fund’s perspective, but the portco CFO and CEO collectively spend 10-15 hours per quarter preparing materials and participating in the session. On a $100K CEO comp, that is roughly $1,500 per quarter in opportunity cost.
The return is decision speed and variance visibility. A portco that catches and corrects an EBITDA miss in Q1 rather than Q4 preserves enterprise value that would otherwise erode. On a $100M exit at a 6x multiple, an 8% EBITDA variance is a $4.8M valuation swing. The dashboard pays for itself if it prevents one significant variance event over the hold period. The return is hard to value directly but shows up in exit outcomes.
Alternatives and Workarounds
Some firms run a hybrid model: annual plan reviews with quarterly variance dashboards that auto-flag the three trigger metrics. The dashboard runs on live data and emails the operating partner when a threshold is breached, but the formal review and re-plan only happen if a trigger fires. This saves the 6-8 hours per quarter of scheduled review time while preserving the early-warning benefit. The downside is that it is reactive rather than proactive, so the team only looks closely when something is already wrong.
Another alternative is the rolling 12-month forecast, updated monthly. The finance team rebuilds the next 12 months of forecast every month based on the most recent actuals. This works well for businesses with stable operating models and predictable drivers, but it does not surface the strategic decisions (re-allocate budget, delay an acquisition, adjust pricing) that require sponsor and management alignment. The rolling forecast is a finance discipline, not a governance process. It keeps the plan current without requiring a quarterly review cycle.
A third option is the asynchronous quarterly review: the operating partner and the CEO exchange a written brief and a dashboard link, discuss variance over a 30-minute call, and document any plan adjustments in a shared memo. This cuts the time cost to 2-3 hours per quarter and works when the relationship is strong and the business is performing within tolerance. It breaks down when variance is material or when the CEO and the operating partner disagree on the cause, because the async format does not support the kind of detailed diagnostic conversation that resolves those disagreements.
Final Verdict: Who Should Move to Quarterly and How
If your portfolio company operates in an environment where CAC, churn, or integration costs have moved more than 15% within a single quarter in the past 18 months, the annual review cadence is too slow. The value creation plan becomes a static document that describes a business model the market has already moved past, and the sponsor is managing to a forecast that will not be hit.
The operating partner and the CEO agree on the three metrics that trigger a re-plan, set the variance thresholds, and commit to a 90-day review cycle before any dashboard is built. This is a governance decision. Once the governance is in place, the dashboard becomes the tool that makes the process efficient.
For firms that lack the internal capacity to build the dashboard, the workaround is to start with Excel-based quarterly reviews and upgrade to live data connections once the process proves valuable. A manually assembled quarterly deck is still better than an annual review that catches variance too late to act on it. The progression is governance first, process second, automation third.
The firms that moved early to quarterly reviews did not do it because they were more sophisticated. They did it because their portfolio companies were missing EBITDA targets and the annual review gave them no mechanism to catch and correct the miss in time to preserve the exit. That is the test: if your plan assumes stable drivers and your actuals show variance, the review cadence is wrong and the plan will be too.
Implementation: The First 90 Days
The operating partner and the CEO schedule the first quarterly review 90 days from the close date and work backward to determine what needs to be in place. The minimum requirement is three months of actuals that can be compared to the plan. The first review cannot happen until the company has closed its third post-acquisition month-end. If the close happens on January 15, the first review happens in late April or early May, not in March. The first quarterly review happens on that schedule regardless of readiness.
Before that first review, the CFO or finance lead builds the variance report. This is a single spreadsheet that shows plan versus actuals for the three trigger metrics, with the variance expressed as both a dollar amount and a percentage. If CAC was forecast at $485 and actuals came in at $521, the variance is +$36 and +7.4%. The report also includes a brief written explanation for any variance over the threshold. This gives the operating partner context before the review meeting starts.
The review meeting itself follows a fixed agenda: variance on the three trigger metrics, the cause of each material variance, the expected trajectory for the next 90 days, and the decision on whether to adjust the plan. The meeting is scheduled for 60 minutes and rarely needs more. If the variances are within tolerance, the review confirms the plan is still valid and the meeting ends. If one or more metrics are outside tolerance, the discussion shifts to whether the variance is a timing issue (revenue delayed but still expected) or a structural change (the market moved and the forecast will not be hit). That distinction determines whether the plan is reaffirmed or revised.
What Happens When the Plan Changes
A revised plan updates the EBITDA bridge, the cash flow forecast, and the capital allocation schedule based on the new reality, and it resets the baseline for the next quarterly review. The revision acknowledges that the assumptions that supported the original forecast no longer hold and that managing to the old plan would produce worse outcomes than adjusting it.
The revised plan does not go back to the IC or the LPs unless the change is material enough to affect the fund’s return projections. A 5% EBITDA adjustment in year two of a five-year hold is usually not material. A 20% adjustment, or a delay to the exit timeline, often is. The operating partner escalates based on the fund’s internal threshold. That threshold is typically defined in the fund’s operating procedures.
Once the plan is revised, the new forecast becomes the plan of record and the prior forecast is archived. The quarterly review process continues on the new baseline, which means the next review compares actuals to the revised plan, not to the original underwriting. This prevents the cognitive trap where the team keeps comparing performance to a forecast that everyone knows is wrong but that nobody has officially retired.
Conclusion
The question is not whether quarterly reviews are better than annual reviews in principle. The question is whether the volatility in your portfolio company’s operating environment justifies the time cost of more frequent governance. If CAC, churn, or integration costs have moved more than 15% within a quarter in the past 18 months, the answer is yes. If those metrics have been stable, the annual cadence is sufficient and the time is better spent elsewhere.
The firms that moved to quarterly reviews early did so because their portfolio companies were missing EBITDA targets and the annual review gave them no mechanism to catch and correct the variance in time to preserve the exit multiple. The quarterly cadence becomes necessary when the business model you underwrote is no longer the business model you are operating.
The implementation itself is straightforward. The operating partner schedules the first quarterly review for 90 days after close, selects the three trigger metrics from the value creation plan, and sets the variance threshold in the MSA or the first board resolution. The portfolio company’s finance or RevOps lead builds the variance report template, a one-page spreadsheet that becomes the standing artifact for every subsequent review. The review meeting is added to the standing calendar with the same participants every quarter: the operating partner, the portfolio company CEO, and the CFO or finance lead.
The cost is four hours of operating partner time per quarter, plus two hours of portfolio company finance time to build the variance report. The benefit is catching a material variance 180 days earlier than the annual cadence would. That is the difference between a mid-course correction and a write-down explanation to the IC. The firms that adopted quarterly reviews in 2023 and 2024 did so because discovering in month eleven that CAC had been running 22% over forecast since month four was costing them exits.