

Overview
Data analytics for portfolio companies is not the same discipline as marketing analytics, product analytics, or business intelligence for an operating team. A sponsor reporting layer exists to answer a narrow set of questions for a private equity firm that owns or controls the business: Is the revenue forecast on track? Where is the variance? What is the CAC trend? Is churn rising? Is the pipeline real? These questions require different instrumentation, different definitions, and different reconciliation paths than the analytics a marketing director uses to allocate budget or an engineering lead uses to prioritize features.
The problem appears after close. The portco has Google Analytics 4, HubSpot dashboards, a Salesforce connector, and Microsoft Clarity for session replay. The sponsor asks for the qualified-lead count. Marketing says 340. Sales says 287. The CRM export has 412 records with “MQL” in the lifecycle field, but 93 of those converted before the tracking migration. Nobody can produce a single number the sponsor trusts, and the board deck becomes a negotiation rather than a report.
This review evaluates the sponsor reporting layer as a distinct build—separate from, and layered on top of, the analytics a portfolio company already runs. It is not a software review. It is an examination of what the reporting layer requires, where standard installs fail, and what a mid-market PE-backed company should expect to invest to produce numbers a sponsor can reconcile.
Who This Is For
The sponsor reporting layer matters to three groups. First, the PE operating partner or deal team member accountable for tracking the portfolio company against its value-creation plan. They need defensible numbers for the quarterly LP report, the board meeting, and the reforecast. Second, the portfolio CEO or CFO who must produce those numbers monthly without turning finance into a data-engineering project. Third, the VP of Marketing or CRO whose dashboard outputs become the source data for sponsor reports and who will be asked why the funnel numbers do not tie out.
This is relevant for companies in the $30 million to $500 million revenue range where the sponsor holds a controlling or influential stake and expects monthly operating metrics. Below $30 million, financial reporting alone often suffices. Above $500 million, the portco typically has a dedicated FP&A function and in-house data engineering capacity. The gap lives in the middle—companies large enough that Excel and gut feel are insufficient, but not large enough to staff a full data team.

What a Sponsor Reporting Layer Requires
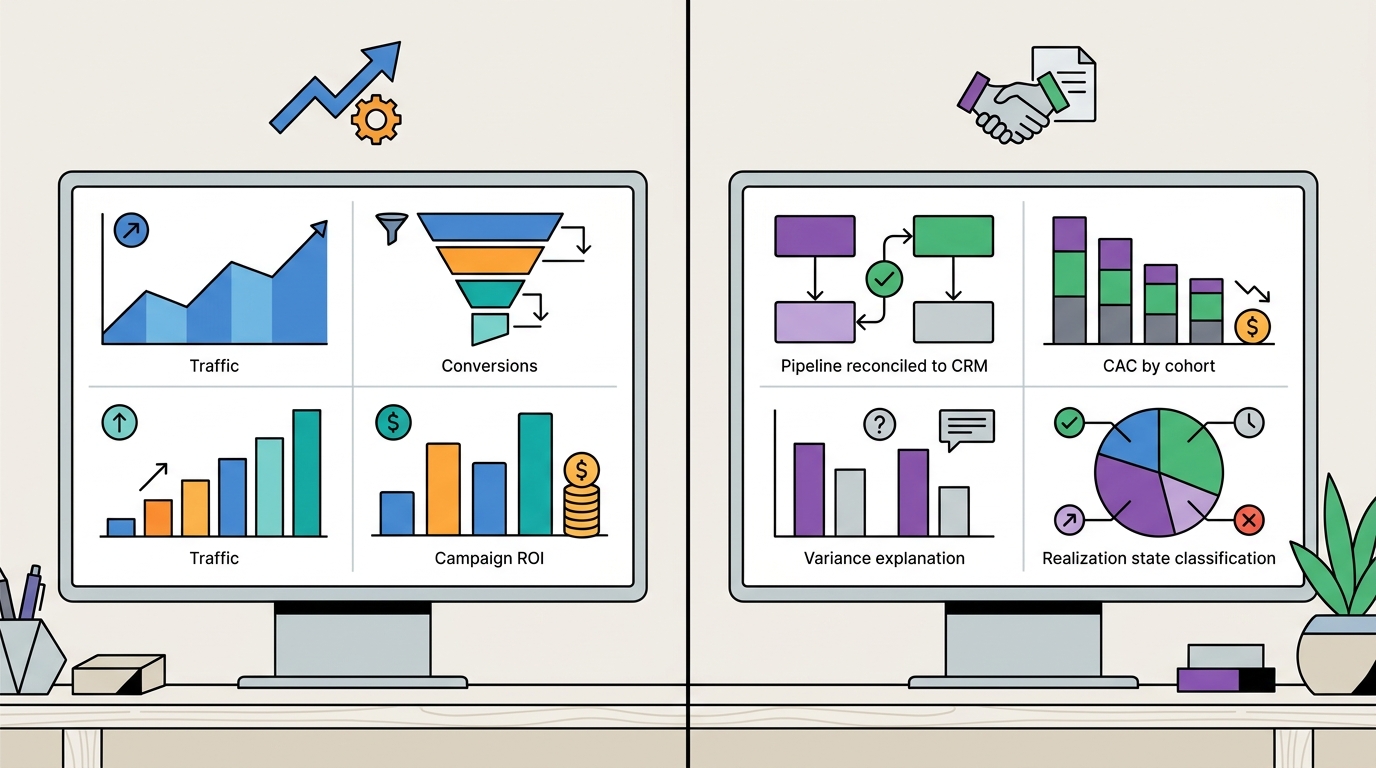
A sponsor reporting layer starts with five requirements that a standard analytics install does not address. First, classification by realization state. Revenue can be realized (collected), booked (recognized but not yet cash), forecast (in pipeline with a close date), enabled (capability built but not yet converting), or risk-avoided (cost or churn prevented). A sponsor needs to know which category a number occupies. Marketing dashboards do not make this distinction—they report traffic, conversions, and campaign ROI without separating what has hit the P&L from what might.
Second, reconciliation paths to financial systems. The qualified-lead count in HubSpot must reconcile to the pipeline-created figure in Salesforce, which must reconcile to the new-bookings line in the management accounts. If those three sources produce different numbers, the sponsor cannot trust any of them. Standard CRM and analytics configurations do not enforce reconciliation—they assume each system is the source of truth for its own domain.
Third, definitions aligned to the investment thesis. If the thesis assumes a 3.2× LTV-to-CAC ratio and 18-month payback, then CAC must be defined the way the model defined it during diligence—including or excluding certain costs, allocated across cohorts the same way. A portfolio company’s marketing team may define CAC differently for internal budget decisions. The sponsor reporting layer enforces the thesis definition, even when it differs from the operating definition the team prefers.
Fourth, event-level tracking for funnel drop-off. Microsoft Clarity shows where users click and scroll. Google Analytics 4 tracks page views and goal completions. Neither, by default, captures form-start events, field-level abandonment, or the specific step in a multi-page flow where a prospect exits. When the sponsor asks why the trial-to-paid conversion dropped 4 percentage points, the answer cannot be “we see the traffic but not where they leave.” Instrumentation must capture the event that precedes the non-conversion, not just the conversion itself.
Fifth, variance explanation built into the report. A dashboard that shows revenue down 8% answers what happened. A sponsor report must also surface why—was it fewer leads, lower close rate, longer sales cycle, or mix shift? The explanation should be derivable from the data layer, not added as commentary after the fact. This requires segmentation and cohort tracking that most analytics installs treat as optional.
Where Standard Installs Fall Short
Google Analytics 4 is configured for digital marketers optimizing campaigns and product managers understanding user behavior. It tracks sessions, events, conversions, and attribution. It does not, out of the box, classify revenue by realization state, enforce definition consistency with a financial model, or reconcile to a CRM. GA4 will tell you that 1,200 users visited the pricing page and 340 started a trial. It will not tell you that 87 of those trials were already in Salesforce as opportunities before they clicked, or that the “trial start” event fires twice for users who reload the confirmation page.
HubSpot and Salesforce dashboards are built for the teams using those systems. HubSpot’s marketing dashboard shows MQL volume, campaign ROI, and email performance. Salesforce’s sales dashboard shows pipeline coverage, win rate, and rep attainment. Neither is designed to reconcile with the other or to roll up into a sponsor-facing format. When a PE operating partner asks for “pipeline created this month,” the CRM may define that as opportunities with a create date in the reporting period, but the marketing attribution model may credit it to leads generated 60 days earlier. Both are correct within their own logic; neither matches the board-deck number.
Microsoft Clarity captures session replays and heatmaps. It is a diagnostic tool for UX optimization, not an analytics platform for value-creation tracking. Clarity will show that users abandon the contact form at the “Phone” field. It will not export a time-series dataset of form-start vs. form-submit events segmented by traffic source, nor will it reconcile that dataset to the MQL count in HubSpot. Clarity answers “what are users doing?” It does not answer “how many qualified leads did we generate, and why is that different from last month?”
The gap is not a failure of these tools—it is a mismatch between what they were built to do and what a sponsor needs. Standard analytics installs optimize for internal operating decisions. The sponsor reporting layer optimizes for external accountability to an investment thesis.
Evaluation Criteria
A sponsor reporting layer should be evaluated against four criteria. First, can the CFO reconcile it to the financials without a data analyst? If producing the monthly sponsor report requires SQL queries, Python scripts, or a BI engineer, the portco is one person’s departure away from losing reporting continuity. The reconciliation path should be documented and repeatable by someone with finance competency but not data-engineering expertise.
Second, does it classify realized vs. enabled value? A capability built but not yet converting is different from revenue recognized. A cost avoided is different from revenue generated. The CFO or CEO preparing the board deck must be able to separate what has hit the P&L from what is forecast or potential. If the report conflates these, the sponsor cannot assess whether the thesis is on track or the team is over-crediting future capability.
Third, does it surface variance explanation in the data? A line chart showing revenue down 6% requires manual investigation to determine cause. A report that segments the drop into “lead volume -3%, close rate -2%, ASP -1%” answers the question in the dataset. The second format reduces the time to action and eliminates the interpretation layer where numbers become negotiable.
Fourth, is it maintained as a separate layer, not a re-architecture of the operating stack? Rebuilding HubSpot workflows or re-tagging GA4 events to satisfy sponsor reporting will break the internal tools the marketing and sales teams depend on. The sponsor layer should sit on top—extracting, transforming, and classifying data from the operating systems without altering their internal logic.
What It Costs to Build
A sponsor reporting layer for a mid-market portfolio company typically requires an initial build of 40 to 80 hours of data-engineering and analytics work, followed by 8 to 12 hours per month of maintenance and reconciliation. The initial build covers event instrumentation (form-start tracking, lifecycle triggers, cohort segmentation), reconciliation logic (HubSpot ↔ Salesforce ↔ financials), and the reporting template the CFO will populate monthly. Maintenance covers variance investigation, definition updates when the business changes, and troubleshooting when an upstream system (CRM, GA4, payment processor) changes its data structure.
The fully-loaded cost depends on whether the work is done in-house, by a fractional data resource, or by an outside firm. In-house requires hiring or reassigning a data analyst with both technical and finance fluency—rare at this scale and expensive to retain. A fractional resource runs $8,000 to $15,000 for the initial build and $2,000 to $4,000 per month ongoing. An outside firm (DevriX’s model, or equivalent) typically bundles sponsor reporting into a broader retainer covering web infrastructure, HubSpot lifecycle automation, and performance optimization, with the reporting layer representing 15% to 25% of the total engagement.
What it costs not to build is harder to quantify but visible in delayed decisions. A sponsor that cannot trust the pipeline number will not approve the next hiring tranche or the geographic expansion until the data reconciles. A board that cannot see where churn is rising will not greenlight the retention program. A deal team preparing for exit cannot defend a multiple if the buyer’s QofE flags data inconsistencies in the CIM. The carrying cost of weak reporting is measured in months, not dollars—months of delayed investment, delayed growth, and delayed exit readiness.
Alternatives
The alternative to a purpose-built sponsor reporting layer is to rely on the portco’s existing finance and marketing teams to produce the numbers manually each month. This works in two scenarios. First, when the portfolio company already has a strong FP&A function with the bandwidth and skill to own reconciliation. Second, when the sponsor’s reporting requirements are limited to financial metrics (revenue, EBITDA, cash) and do not extend to operating metrics (pipeline, CAC, churn, lead volume).
For most PE-backed companies in the $30 million to $500 million range, neither condition holds. The finance team can produce clean P&L and cash-flow statements but lacks the tooling or expertise to reconcile CRM data to those financials. The marketing and sales teams can export HubSpot and Salesforce reports but do not know which definitions the sponsor’s model assumes. The gap falls between functions, and the monthly reporting cycle becomes a scramble.
A second alternative is to deploy a BI platform (Tableau, Looker, Power BI) and staff it with an in-house analyst. This works for companies at the larger end of the range ($200 million-plus) where data headcount is justified. Below that scale, the platform itself becomes the project—buying Looker does not solve the problem if nobody owns the data model, maintains the connectors, or enforces the reconciliation logic. The tool is necessary but not sufficient.
A third alternative, common in the first 12 months post-close, is to treat sponsor reporting as a finance deliverable and accept that the CFO will spend two to three days per month manually pulling and reconciling numbers. This is defensible as a short-term bridge if the company is prioritizing other integration work (sales-team restructure, ERP migration, product roadmap). It is not sustainable beyond year one. The CFO’s time is too expensive, the error rate is too high, and the lack of event-level data means the reports answer what but rarely why.
Final Verdict and Recommendation
Data analytics for portfolio companies is not the same as marketing analytics or product analytics. The sponsor needs numbers that reconcile to the investment thesis, classify realized vs. enabled value, and surface variance explanation in the dataset rather than in post-hoc commentary. Standard analytics installs—GA4, HubSpot dashboards, Clarity—are built for internal operating decisions, not external accountability to a PE firm. The gap is predictable, fixable, and expensive when ignored.
The recommendation depends on where the portfolio company is in its hold period. In the first six months post-close, during integration and before the first reforecast, the CFO can produce sponsor reports manually if the financial systems are clean and the definitions are documented. This is a bridge, not an operating model. By month nine, the company should have event-level tracking instrumented, reconciliation paths documented, and a repeatable process that does not require the CFO to spend three days per month in Excel.
For companies 12 to 18 months from exit, the sponsor reporting layer becomes exit-readiness infrastructure. A buyer’s quality-of-earnings process will test whether the numbers in the CIM are defensible. If marketing says 1,200 MQLs and the CRM export shows 1,400 records with “MQL” in the lifecycle field, the buyer will assume the seller does not know their own business. The QofE will reprice the deal or introduce an earnout to transfer the risk. Building the reporting layer 12 months before process is cheaper than explaining data gaps to a buyer’s diligence team.
The clearest forcing event is the first board meeting where the sponsor asks a follow-up question the dashboard cannot answer. “Pipeline is up 12%—is that more leads, higher conversion, or larger deal sizes?” If the answer is “we will get back to you,” the company does not have a sponsor reporting layer. It has a screenshot of a dashboard. The cost to build the layer is 60 hours and $12,000. The cost of not building it is measured in credibility, delayed decisions, and months added to the exit timeline. For a PE-backed company in the mid-market, that trade-off is not close.
If your portfolio company is producing sponsor reports by manually reconciling CRM exports to financial statements each month, and the CFO cannot explain why the MQL count differs between HubSpot and Salesforce, you do not have an analytics problem. You have a reporting-layer problem. The fix is not more dashboards—it is purpose-built instrumentation, documented reconciliation paths, and a repeatable process that does not depend on one person’s Excel skills. That is what a sponsor reporting layer delivers, and it is what separates portfolio companies that report numbers from portfolio companies that report numbers the sponsor trusts.
When to Build the Layer and When to Wait
The decision on when to instrument a sponsor reporting layer comes down to three factors: hold period, complexity of the business model, and credibility risk with the sponsor. A single-product SaaS business with clean Stripe data and 200 accounts can often survive on manual reconciliation for the first year. A multi-brand consumer company with four payment processors, three currencies, and channel attribution across paid, organic, and retail cannot. The cost of delay is not linear—it compounds with every board meeting where the CFO hedges an answer or the sponsor questions a variance that should have been visible in the data.
For companies within 24 months of a planned exit, the sponsor reporting layer becomes exit infrastructure. EY’s 2024 benchmarking study found that 72% of PE firms cite weak data and KPI reporting as the biggest finance issue surfaced during exit diligence. A buyer running quality-of-earnings on a carve-out or add-on will test whether revenue, pipeline, and customer-cohort metrics reconcile to the financial statements. If the CIM says customer acquisition cost dropped 18% year-over-year and the buyer’s data room review shows three different CAC definitions across quarterly reports, the deal will reprice or the earnout will shift risk to the seller. Building the layer 18 months before process is a fraction of the cost of explaining data gaps to a skeptical buyer.
The clearest early warning signal is the first board meeting where a sponsor follow-up question cannot be answered from the dashboard. “MQL volume is up 14% quarter-over-quarter—is that more top-of-funnel traffic, higher landing-page conversion, or a change in the MQL definition?” If the answer is “we will pull that and get back to you,” the company does not have a sponsor reporting layer. It has screenshots of operational dashboards that were never designed to answer accountability questions. The gap is fixable, but it requires accepting that GA4 and HubSpot are starting points, not solutions.
What Good Looks Like
A functional sponsor reporting layer has three properties. First, every number presented to the board ties to a documented data source with a reconciliation path to the financial statements. Marketing says 1,200 MQLs; the CFO can show the Salesforce query, the lifecycle-stage filter, and the deduplication logic that produced that count. Revenue says $4.2M in new ARR; the finance team can tie it to recognized revenue, show the cohort it came from, and explain the $180K variance from forecast.
Second, the layer classifies impact as realized, run-rate, forecast, enabled, or risk-avoided rather than conflating activity with outcome. A dashboard that shows “deployed 12 A/B tests this quarter” is operational reporting. A dashboard that shows “conversion rate improved 240 basis points, contributing $87K in incremental monthly revenue now running at steady state” is sponsor reporting. The sponsor cares about enterprise value, not velocity.
Third, the system surfaces variance explanation in the data rather than requiring manual commentary. If CAC spiked 22% in March, the dashboard should show which channel drove it, which cohort it affected, and whether it was a timing issue or a structural shift. The CFO should not need to spend four hours in Excel reverse-engineering what happened. The reporting layer should make variance visible, comparable, and traceable to a decision or external event.
Companies that operate this way do not produce prettier slides for the board deck. They produce faster decisions, fewer credibility gaps, and exit processes that do not stall on data-room questions. The CFO spends board prep reviewing insights rather than reconciling exports. The sponsor asks second-order questions because the first-order answers are already in the dataset. And when a buyer’s diligence team requests customer cohort analysis or payback-period waterfalls, the company sends a report rather than scrambling to build one.
The Real Cost Is Organizational, Not Technical
The hard part of building a sponsor reporting layer is not the instrumentation—it is the agreement on definitions. Marketing and sales will have different MQL criteria. Finance and RevOps will have different churn formulas. Product and the data team will have different definitions of an active user. These conflicts are not technical problems. They are governance problems, and they do not resolve themselves. Left unaddressed, they produce dashboards where every metric has an asterisk and every board meeting ends with “we will reconcile offline.”
The forcing mechanism is a definitions document owned by the CFO and reviewed by the sponsor. One page, updated quarterly, that defines how every board-level metric is calculated, where it comes from, and what reconciliation path ties it to the financials. MQL is a HubSpot lifecycle stage, filtered by these criteria, deduplicated this way, and reconciled to pipeline this way. Churn is monthly revenue lost from customers who canceled, calculated on this cohort, excluding these edge cases. CAC is total sales and marketing expense divided by new customers acquired, with this attribution window and these exclusions.
Most portfolio companies resist this exercise because it forces uncomfortable conversations. Marketing does not want to admit that 18% of their MQLs are duplicates or unqualified. Sales does not want to explain why pipeline coverage is calculated differently in the forecast model than in Salesforce. The data team does not want to document that three different event schemas are in production because nobody prioritized cleanup. These are exactly the conversations that must happen. A buyer will surface them in diligence. A sponsor will surface them the first time a forecast misses. Forcing them early is cheaper.
When Manual Reconciliation Is the Right Bridge
Not every portfolio company needs a fully automated sponsor reporting layer in month six. A company in the middle of a sales-team restructure, an ERP migration, or a product-roadmap reset can reasonably defer instrumentation work if the business fundamentals are stable and the sponsor is aligned on priorities. The CFO can produce board metrics manually—export HubSpot, reconcile to Salesforce, tie to revenue, document assumptions—as long as three conditions hold.
First, the manual process must be documented and repeatable. If only one person knows how to produce the numbers, the company has a key-person risk, not a reporting process. Second, the time cost must be bounded. Two to three days per month is defensible; a full week is not. The CFO’s time is too expensive to spend manually pivoting CRM exports. Third, there must be a plan to automate. Manual reconciliation is a bridge to instrumentation, not an operating model. If the company is still doing it manually 18 months post-close, the bridge has become permanent infrastructure, and the cost has compounded.
The forcing event is usually the first material variance that the sponsor questions and the CFO cannot explain from the dataset. Pipeline dropped 9% month-over-month—was it fewer leads, lower conversion, longer cycle time, or a data-quality issue? If the answer requires three days of analysis, the company does not have a reporting layer. It has a reactive reconciliation process that will fail under pressure.
The Buyer’s View: Data Readiness Is Part of the Asset
A buyer evaluating a portfolio company does not separate “the business” from “the data about the business.” Revenue quality, customer cohorts, unit economics, and retention are not discovered in diligence—they are verified. If the company cannot produce cohort retention by acquisition channel within 48 hours, the buyer’s assumption is that retention is either unknown or bad. If CAC payback cannot be shown by product line, the buyer will model the blended number down by 20% and move on. Data opacity does not get the benefit of the doubt. It gets a valuation haircut.
This is why EY’s recommendation to secure data readiness 12 to 24 months before exit is not conservative—it is realistic. A company that starts instrumentation work six months before a process is starting too late. The definitions fight will surface problems that require operating changes, not just schema fixes. Marketing will realize that lead scoring has been broken for eight months. Sales will discover that two CRM instances were never merged after an acquisition. Finance will find that churn is being calculated three different ways across three dashboards. Fixing these is not a sprint. It is a multi-quarter program that runs in parallel with the business.
The companies that command premium multiples at exit are the ones where every buyer question has a data answer, delivered in hours, not days. The CFO can show cohort behavior by acquisition quarter. The CRO can show pipeline coverage and conversion rates by segment and rep. The CMO can show CAC and LTV by channel with reconciliation to the P&L. These are not technical achievements. They are governance achievements that required the sponsor, the CFO, and the functional leads to agree on definitions, enforce them in-system, and maintain them through org changes and product shifts.
What Good Looks Like
A portfolio company with a functional sponsor reporting layer can produce a full board package—P&L, balance sheet, cash flow, operational KPIs, cohort analysis, pipeline forecast—within two business days of month-end close. The metrics reconcile to the financials without manual adjustment. Variances are explainable from the dataset, not from memory. The definitions document is current, and every board-level metric traces to a single source of truth.
The CFO does not spend the week before a board meeting building slides. The slides are automated, and the CFO spends that time on analysis—why did retention improve in the enterprise segment, what drove the pipeline coverage increase, where is the CAC/LTV trend headed. The sponsor does not ask “how did you calculate this” because the calculation method is documented and has not changed. The operational reviews focus on what happened and what to do about it, not on reconciling conflicting numbers.
This is not a utopian standard. It is table stakes for a company preparing for exit or scaling under institutional ownership. The companies that treat sponsor reporting as a compliance task rather than a value-creation input are the ones that show up to exit diligence with spreadsheets, asterisks, and explanations. The companies that treat it as foundational operating infrastructure are the ones that show up with a data room the buyer can verify in days, not weeks, and a valuation that reflects confidence rather than risk.
