

By Mario Peshev, DevriX
Most analytics work inside portfolio companies produces dashboards nobody uses to make a decision. I have sat in enough operating reviews to know the pattern. A management team presents forty charts, the operating partner nods, and the one number that would change the hold thesis is either absent or buried three tabs deep. The company is not short on data. It is short on the two or three signals that move enterprise value, delivered on the cadence a board actually runs.
If you are a deal partner or an operating partner, you are not buying analytics. You are buying earlier warning on a revenue miss, defensible forecasts your CFO can stand behind in a lender call, and evidence at exit that the growth story is real and repeatable. That is the whole point. Tickets, dashboards and data volume are the vendor register, not the outcome. The outcome is a decision made sooner, with less risk, backed by numbers that survive diligence.
This piece is about what to demand from data analytics in a portfolio company, and how to judge whether what you are getting is worth the line item.
The problem is not too little data. It is data that does not decide anything.
Every mid-market B2B business I have worked with is already drowning in data. CRM, billing, the marketing stack, product telemetry, a general ledger, a support system. The failure is almost never collection. It is that the data lives in separate systems with different definitions of the same word, and no one has decided which numbers a board will actually govern by.
Ask three people in the same company what “active customer” means and you will get three answers. That is not a technical problem you fix with a better tool. It is a governance problem. Until the sponsor and management agree on a small set of defined metrics and who owns each one, more analytics spend just produces more disagreement at higher resolution.
Bain’s annual private equity report has tracked for years how value creation has shifted away from multiple expansion and financial engineering toward operational improvement. You can read the through-line in Bain’s Global Private Equity Report: when the returns have to come from running the business better, the sponsor needs to see the business clearly, in near real time, in terms that map to the value creation plan. Analytics is the instrument panel for that plan or it is decoration.
I have written before about why PE value creation requires embedded partners, not advisory firms. The same logic applies here. A deck that describes the state of the data does not change the P&L. A working reporting layer that surfaces a churn spike six weeks earlier does.
Start from the decision, then work backward to the metric
The discipline I hold every portfolio analytics build to is simple. Name the decision first. Then name the metric that informs it. Then, and only then, talk about the pipeline and the tooling. Reverse that order and you get a data warehouse project with no owner and a two-year payback nobody underwrote.
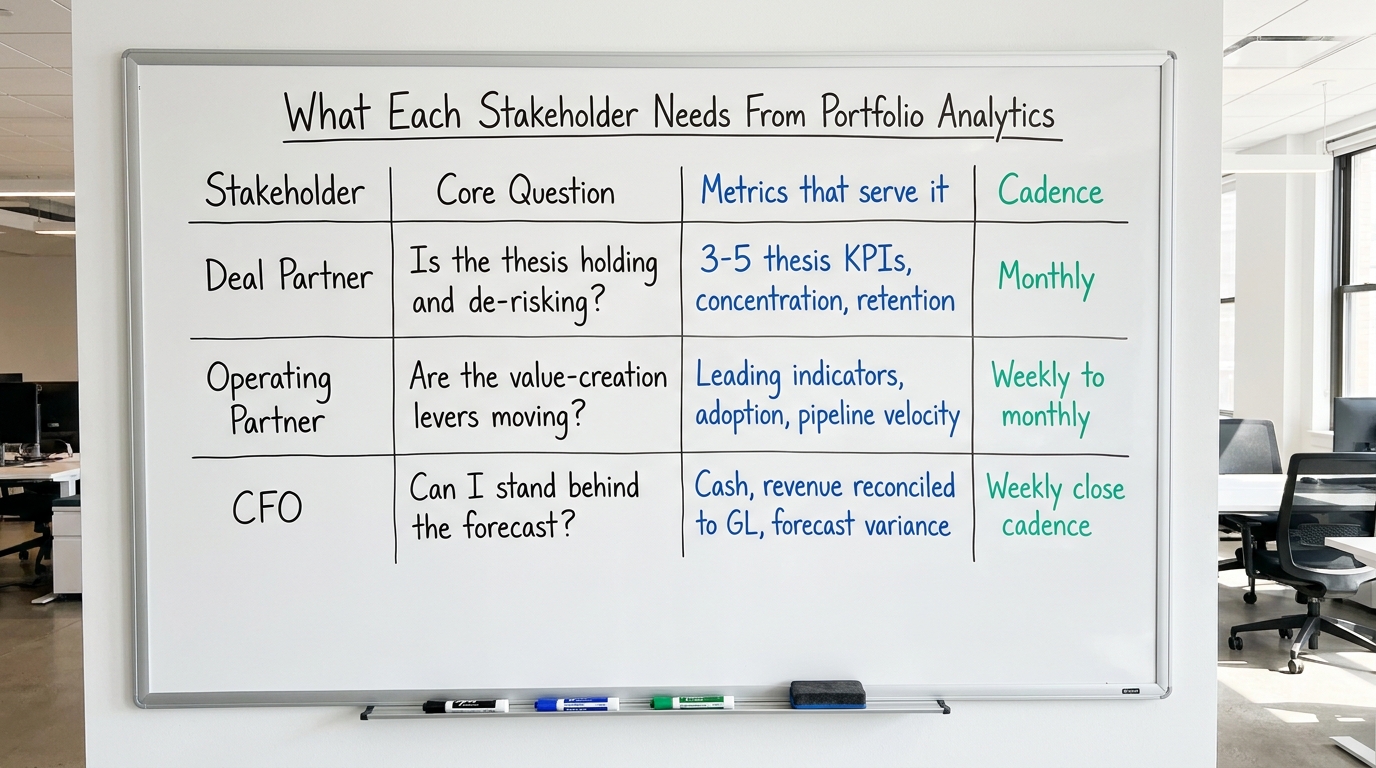
A deal partner and an operating partner want different decisions served, and the analytics should reflect that.
What the deal partner actually needs
The deal partner cares about the thesis holding, the risks that would break it, and the path to exit. That reader does not want a description of engineering activity. They want to know whether the growth in the model is showing up in the data, whether the concentration risk flagged in diligence is getting better or worse, and whether the story they will tell a future buyer is accumulating evidence. Three to five metrics, monthly, tied to the investment thesis. Not forty.
What the operating partner actually needs
The operating partner lives closer to the machine. They want adoption, speed, and a repeatable playbook that survives across the portfolio. Their analytics question is whether the levers in the value creation plan are moving, and where the team is stuck. This reader benefits from leading indicators, not just lagging ones, because they still have time to act.
What the CFO needs, and why it is the hardest
The CFO needs forecast reliability, cash visibility, and numbers that reconcile to the general ledger and survive a quality of earnings review. This is where most homegrown dashboards fall apart. A marketing dashboard that says revenue is up while the finance system says something different is worse than no dashboard, because it destroys trust in every other number on the page. Any analytics layer that does not reconcile to finance is a liability, not an asset. When add-backs and normalizations enter the picture, the analytics have to survive the scrutiny I described in adjusted EBITDA and the art of add-backs.
The metrics that actually earn their place on the board deck
For a B2B business, the short list that governs enterprise value is not long, and it is not exotic. I have covered the commercial side of this in depth in portfolio company operating reviews and the commercial KPIs that matter, so I will keep this to the analytics implications.
- Net revenue retention and gross retention. These tell you whether the base is durable before you spend a dollar on new logos. If they are moving the wrong way, no amount of new pipeline saves the thesis.
- Pipeline coverage and velocity by segment. Coverage tells you if the quarter is at risk. Velocity tells you where deals are stalling, which is a leading indicator you can act on.
- CAC payback and unit economics by channel. Blended numbers hide the truth. The moment you split by channel and segment, the profitable motion and the money pit separate cleanly. I go deeper on this in the context of how fractional CROs fix win rate and CAC.
- Revenue and margin by cohort, product, and customer. Concentration risk and margin erosion both live here, and both are diligence red flags a future buyer will find.
- Cash conversion and forecast variance. The gap between what the company forecast and what it delivered, tracked over time, is the single best proxy for how much you can trust the next forecast.
Notice what is missing. Website traffic. Total tickets closed. Number of dashboards built. Those are activity metrics, and activity is not outcome. If your analytics investment mostly reports on itself, you have bought the vendor register.
How to classify what the numbers are actually claiming
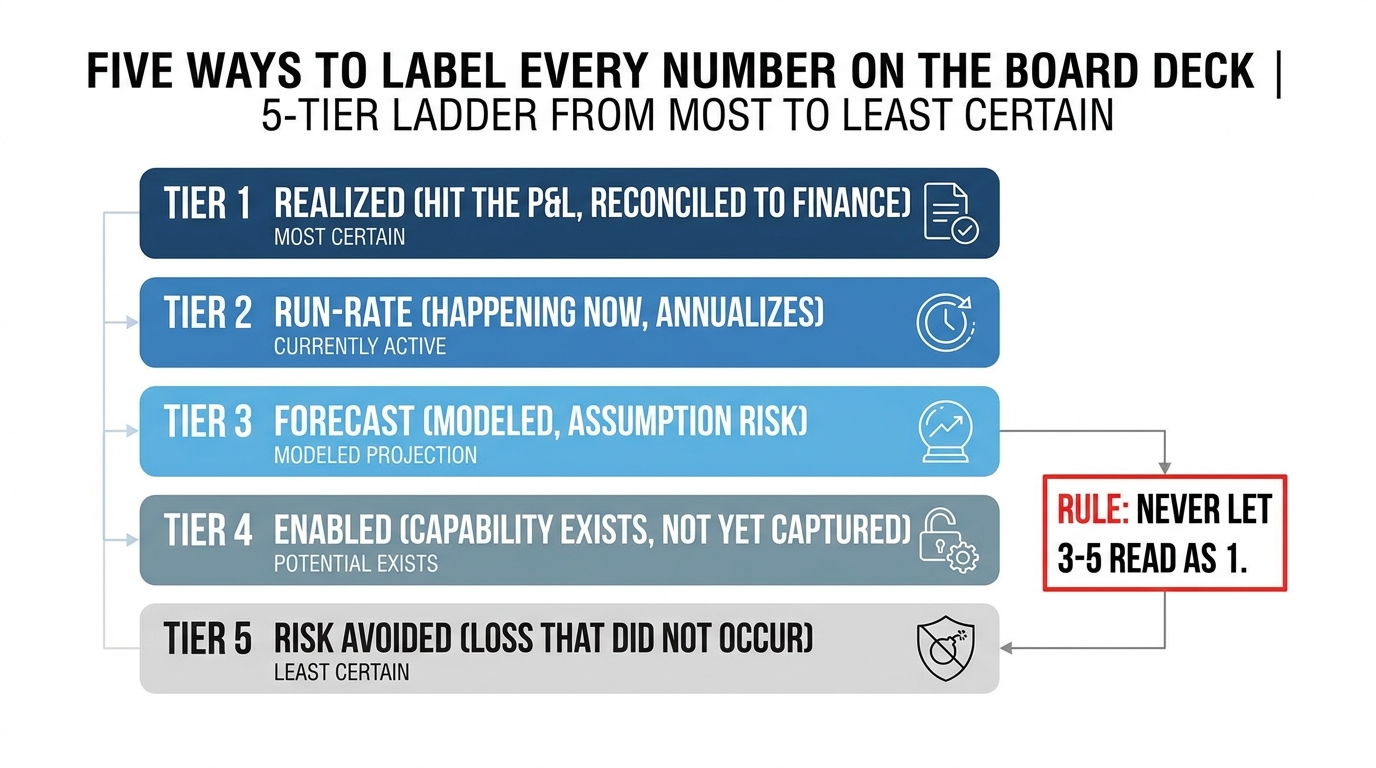
One habit separates analytics that hold up in a board room from analytics that get quietly ignored. Every number should be labeled by what kind of value it represents. I use five categories, verbatim, in operating reviews.
- Realized. It already hit the P&L or the bank account. Reconcilable to finance.
- Run-rate. It is happening now and annualizes, but a full year has not landed yet.
- Forecast. Modeled, not yet earned. Carries assumption risk.
- Enabled. The capability now exists to capture it, but capture has not happened.
- Risk avoided. A loss that did not occur, which is real but easy to overstate.
The failure mode I see most often is a slide that lets forecast and enabled value read like realized value. That is how a growth story inflates until diligence deflates it. A disciplined reporting layer keeps these separated on the face of the report, so the board always knows which dollars are in the account and which are in a model.
What good actually looks like in the first hundred days
You do not need a two-year data platform to get the signal that matters. In a newly acquired business, I sequence it the way I lay out the 100-day go-to-market plan. The analytics track runs in parallel and it is deliberately narrow at first.
Weeks one to four: agree on definitions and find the source of truth
Pick the fifteen metrics that will govern the board deck. Write down the exact definition of each and which system is the authoritative source. Reconcile the revenue and cash numbers to the general ledger. This step is unglamorous and it is where the entire program lives or dies. If finance and commercial cannot agree on a revenue number in month one, they will not agree in month twelve either.
Weeks five to eight: stand up the reporting layer, not the data lake
Connect the sources for those fifteen metrics and produce the first real board pack from live data. Resist the urge to build the comprehensive warehouse. You are proving the loop works and that the numbers reconcile, not boiling the ocean.
Weeks nine to thirteen: add leading indicators and start the cadence
Now layer in the forward-looking signals the operating partner needs, and lock the operating cadence. A weekly commercial number for the operating team, a monthly pack for the board. The cadence is the product. A perfect dashboard that gets looked at once a quarter changes nothing.
Along the way, the same exercise surfaces problems worth money on their own. Running the numbers cleanly is exactly how you find the leaks I describe in the B2B portfolio revenue leakage diagnostic, and it flags the issues that turn into commercial due diligence red flags if left alone until exit.
How to judge whether you are getting value
Here is the test I apply, and it has nothing to do with how the dashboards look. McKinsey’s work on private capital and BCG’s principal investors practice both keep returning to the same theme, that operational rigor and clean data discipline separate the funds that consistently create value from the ones relying on leverage and multiple expansion. You can trace that argument across McKinsey’s private capital research and BCG’s private equity work. Judge your analytics against these questions.
- Did a decision change because of a number? If you cannot name a decision the analytics moved in the last quarter, you are paying for reporting theater.
- Do the numbers reconcile to finance? If commercial and finance disagree on revenue, trust in the whole layer collapses.
- Are leading indicators present, or only lagging ones? Lagging metrics tell you the quarter is already lost. Leading ones give the operating partner time to act.
- Is forecast variance shrinking? The gap between forecast and actual, over time, is the honest measure of whether the analytics are improving decisions.
- Would this survive a buyer’s diligence? If the growth story rests on numbers you cannot defend, you have built a problem for exit, not an asset.
PitchBook’s data on holding periods is a useful reality check here. Deal timelines have stretched, which means the reporting layer you stand up early has to serve the whole hold, not just the first board meeting. It is worth watching how those patterns move in PitchBook’s research and data, because a longer hold raises the cost of running blind.
The mistake that shows up at exit
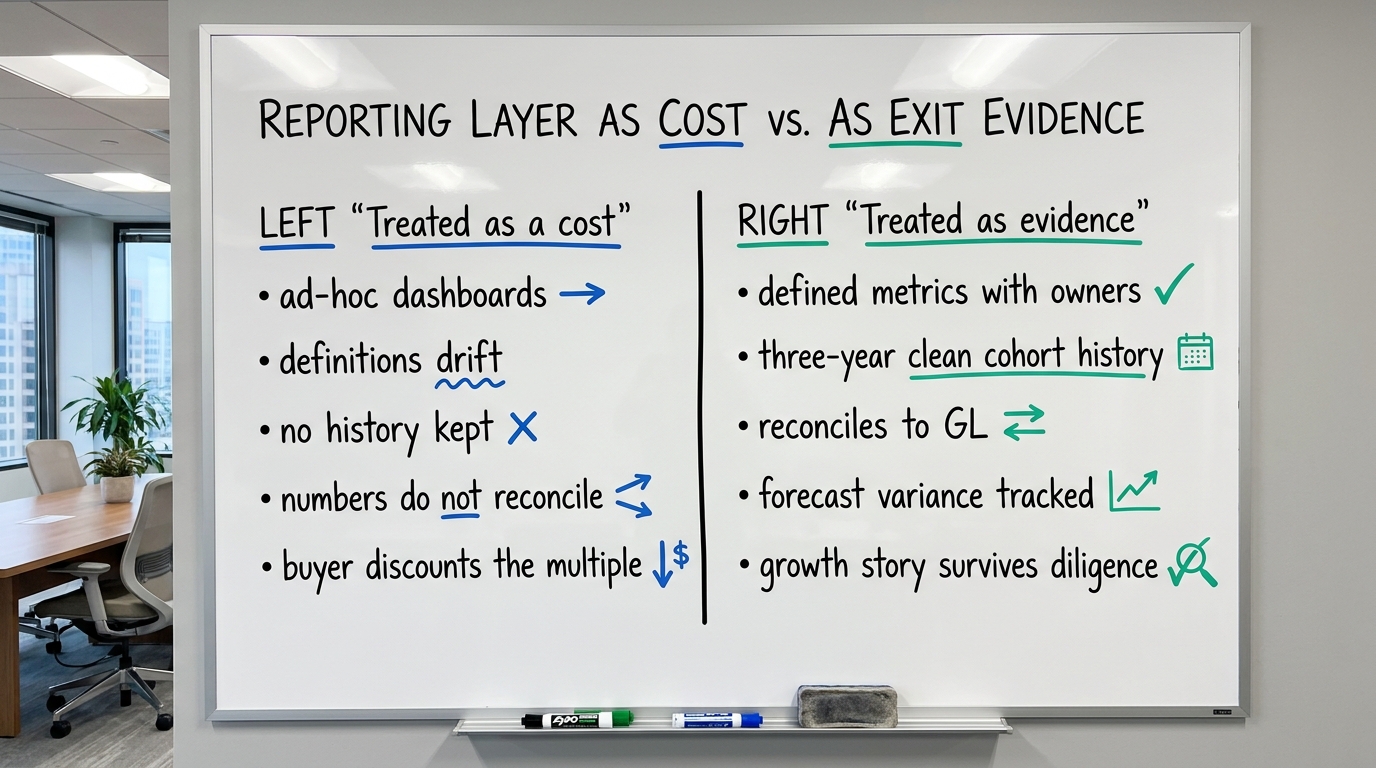
The most expensive analytics failure does not show up in year one. It shows up in the sale process, when the buyer’s team asks for cohort retention going back three years and the seller cannot produce it because the definitions changed twice and no one kept a clean history. Now the growth story rests on assertion instead of evidence, and the discount lands squarely on the multiple.
I have watched this drag value off the table. A business that could tell a clean, data-backed retention and unit-economics story commands a premium over one telling the same story from memory. The analytics layer is not a cost center. Built right, it is the evidence file for the exit narrative, and it is being assembled from day one whether you plan it or not. This connects to a broader point I make about avoiding value creation pitfalls in PE go-to-market: the story you cannot prove is a story a buyer will not pay for.
The Harvard Law School Forum on Corporate Governance has published extensively on disclosure quality and diligence standards, and the direction is consistent. Buyers and their advisors are more forensic than they were a decade ago. You can browse the relevant material at the Harvard Law School Forum on Corporate Governance. The practical takeaway for a sponsor is that data hygiene during the hold is diligence readiness at exit.
Build to the decision, and buy the discipline you do not have
Most portfolio companies can wire together tools. What they usually lack is the operating discipline to decide which numbers govern the business, to keep those definitions stable across the hold, and to run the cadence that turns numbers into decisions. That discipline is the difference between analytics as expense and analytics as enterprise value.
The distinction I keep coming back to is the one between advisors who describe the problem and operators who own the P&L consequence, which I unpack in value creation consultants versus operators. A slide that names the data gap is worth very little. A working reporting layer that a CFO trusts, a board governs by, and a buyer can diligence is worth a real slice of the exit multiple. If you want the wider view on building organizations that hold up under this kind of scrutiny, I collected it in 26 lessons for future-proofing organizations.
Where to take this next
If you are holding a portfolio company where the board deck is forty charts and no decision, or where finance and commercial cannot agree on a revenue number, the fix is not more tooling. It is a Sponsor Reporting Layer built from the decisions backward, reconciled to finance, and run on a real cadence from the first hundred days through exit.
That is the work my team does. If you want to pressure-test your current analytics against the questions in this piece, start with a value creation advisory conversation, and see how DevriX builds reporting layers that hold up in a board room and in diligence at the DevriX private equity practice. The right time to build the evidence file is the day you close, not the day you sign the sale mandate.
